Case Study · In Production

The entire shop floor — live in one browser window.

14 CNC machines, a PV system and a compressor report their status in real time — and next to each machine you see what it is currently producing according to abas ERP, and what is up next. Before, this picture was scattered across Grafana charts, ERP screens and a walk through the shop.

Built for R&W Maschinenbau

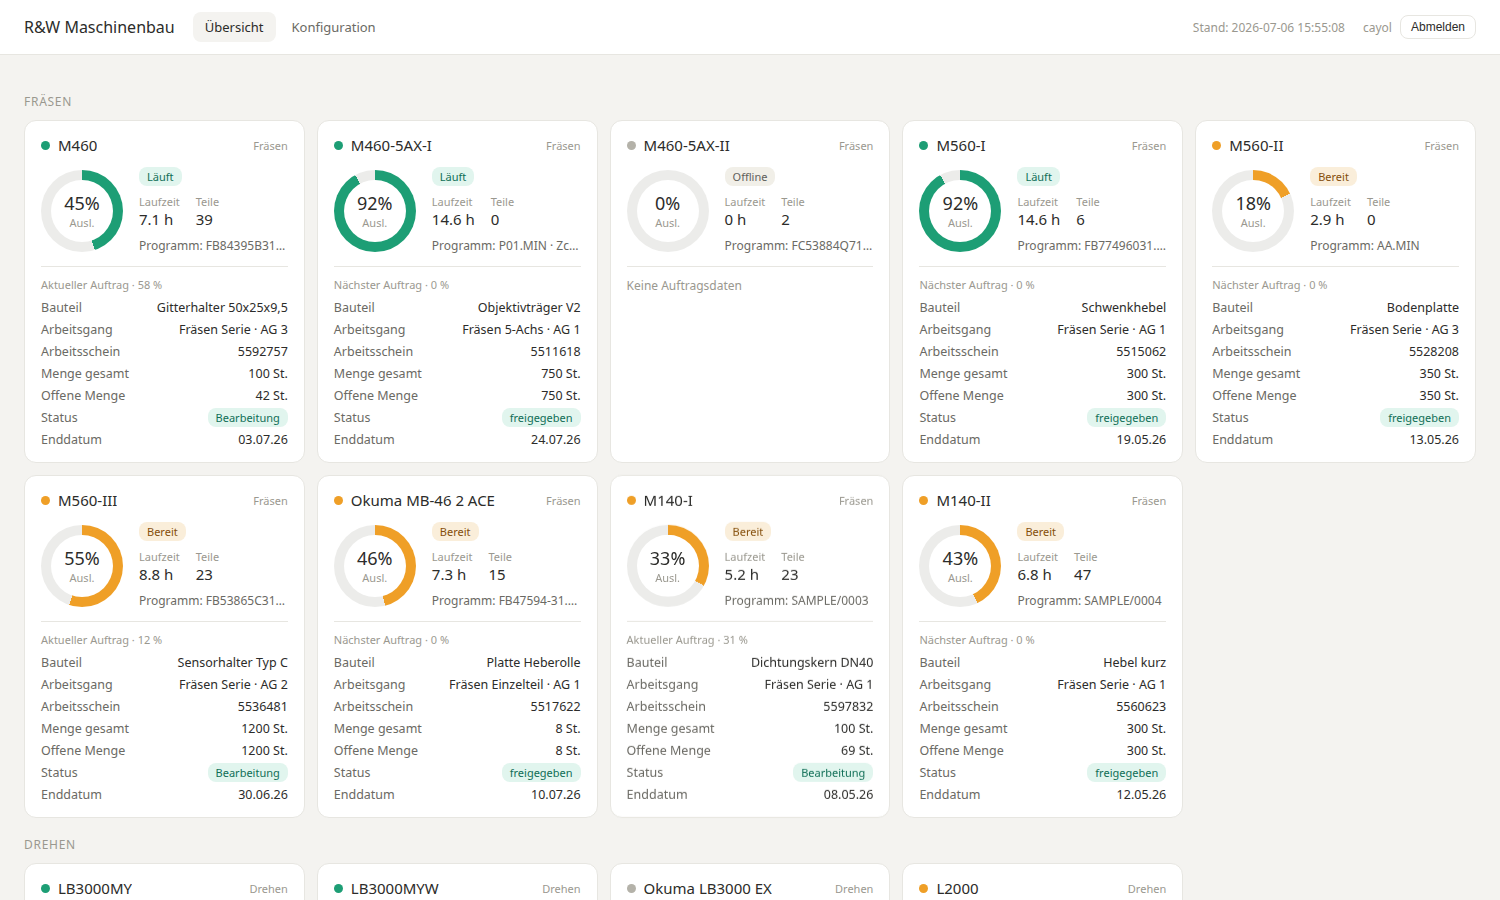
Machine dashboard with live tiles for all CNC machines: utilization, status and the current order from abas

The result — an MES built to spec

From the customer's requirements specification to a production interface: the machines' actual state and the production plan's target state, merged into one system.

16
machines & assets live
6
data source types, one screen
5 s
refresh cycle in the browser
Live status

Every machine is a tile — honest and in real time.

Running, ready, faulted, off or offline: the raw states of all controllers are normalized to a unified traffic-light scheme. Utilization is calculated against the time of day elapsed so far — a machine that has been running since midnight shows 100 % at any hour. When a fault occurs, the actual alarm text appears right on the tile.

Unified traffic-light scheme Fair utilization Alarm texts
Target meets actual

The work queue comes straight from abas.

For every machine, the tile shows the running order from the abas work queue: part, operation, total and open quantity, progress, due date. Hovering reveals the next scheduled operations — in exactly the order abas plans them. Workstations without a machine connection (die-sinking EDM, assembly) get their own order tile, too.

abas infosystem via REST Current order & preview Quantities & progress
Drill-down

A detail page with runtime history — on the phone, too.

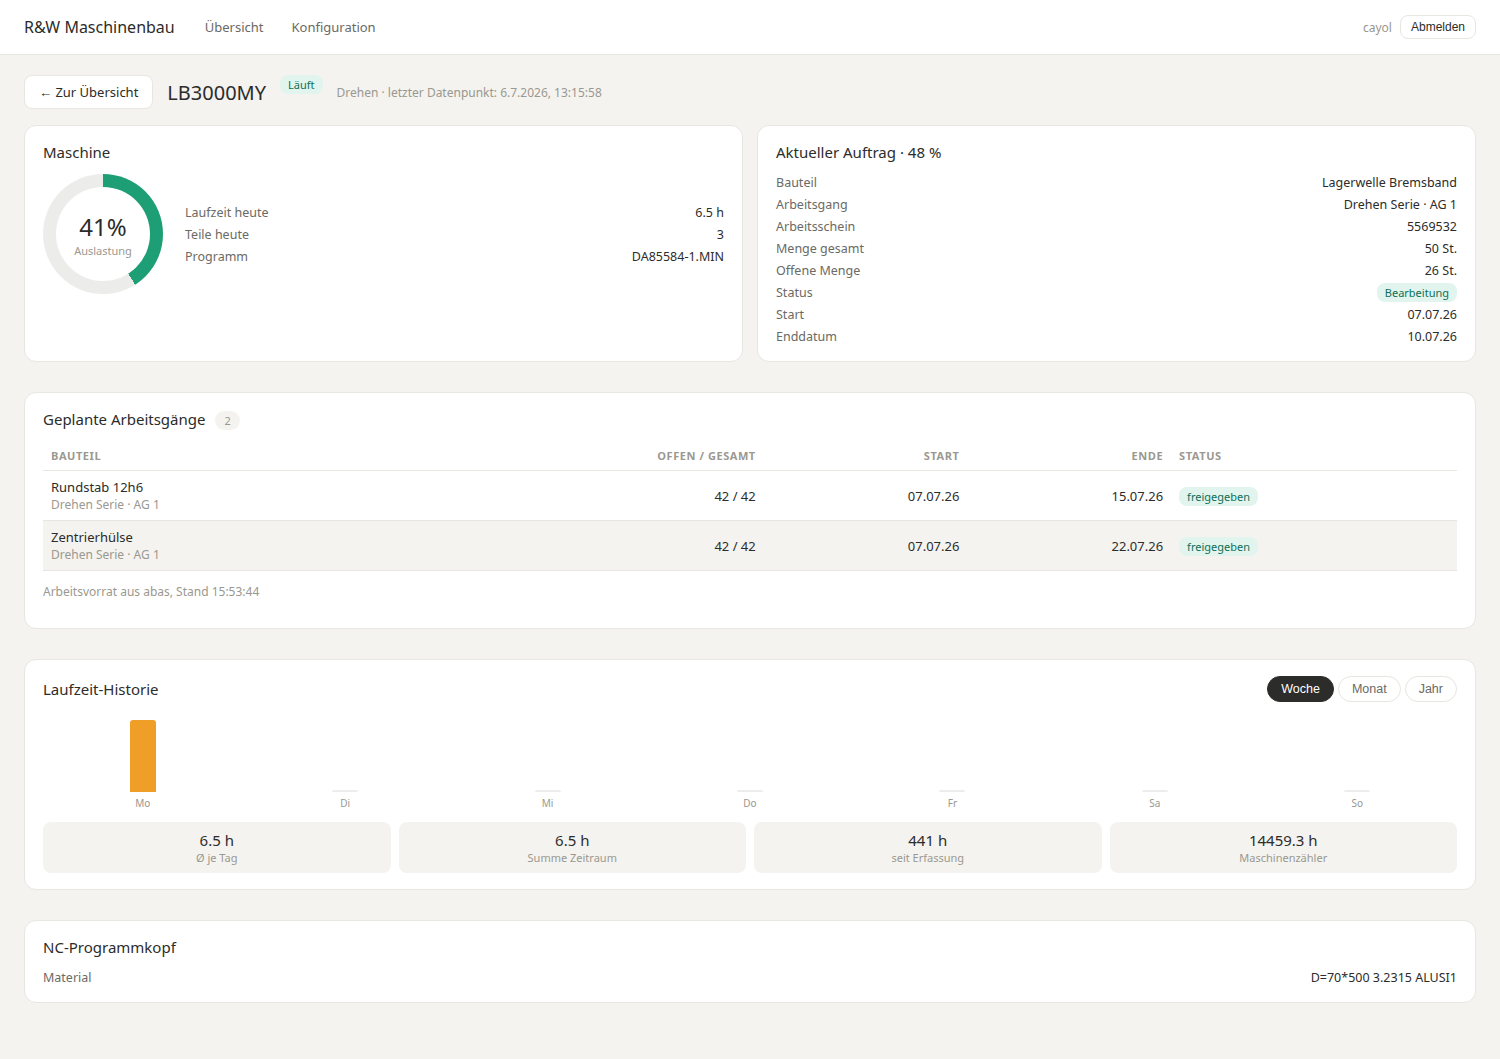
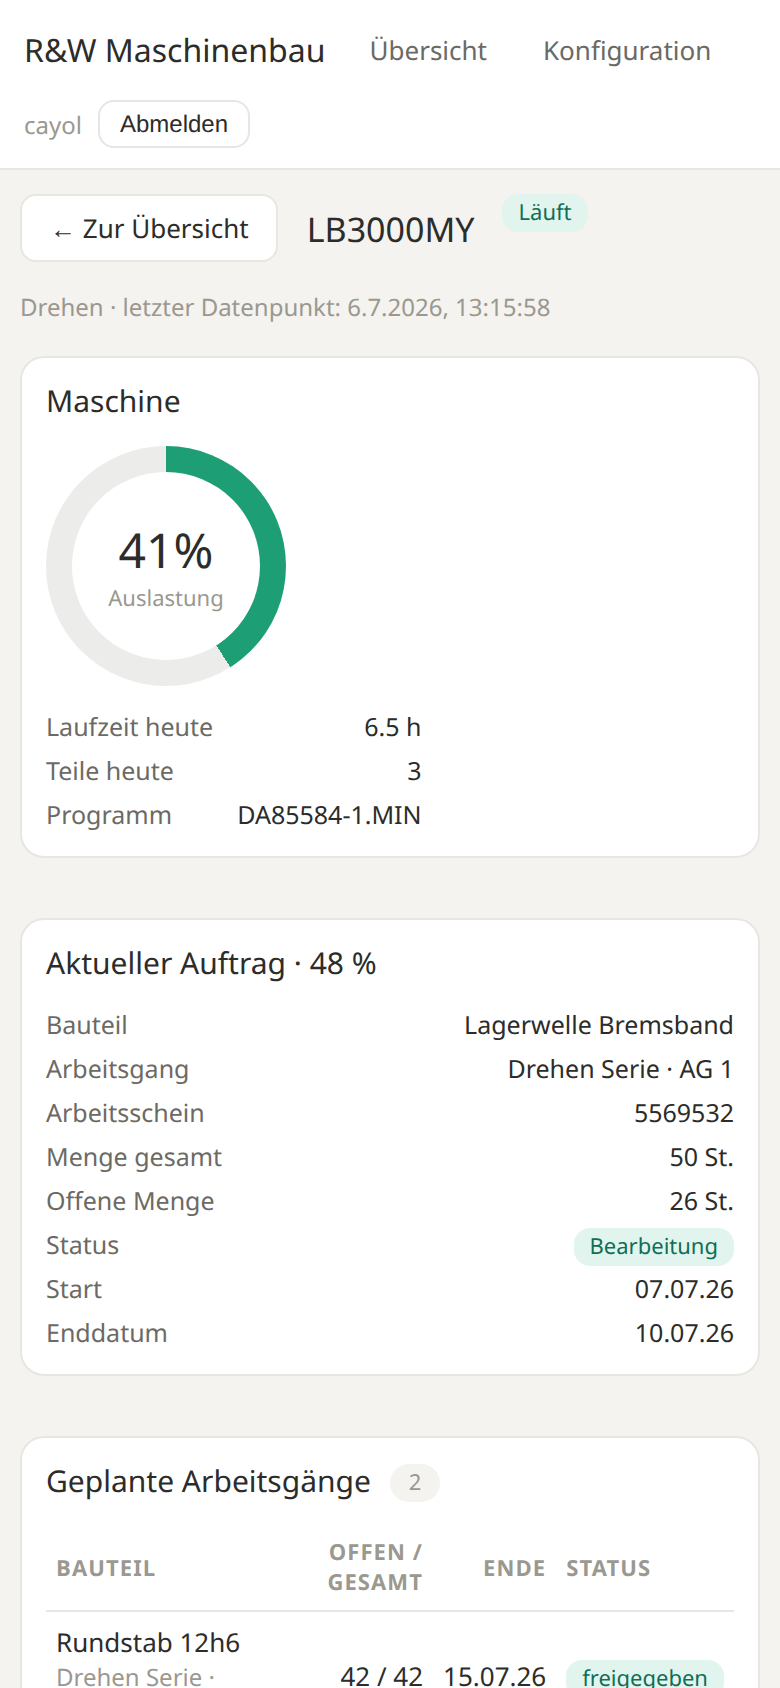
One click opens the machine page: a large utilization gauge, all scheduled operations, the NC program header with target times — and the runtime history as a bar chart, switchable between week, month and year, all the way to the total runtime since data collection began. The layout is made for the shop floor: it works on the foreman's PC just as well as on a smartphone.

Week / month / year Total runtime Mobile-ready

A look inside the cockpit

This is what the dashboard's daily routine looks like — shown here with sample data.

Dashboard overview with machine tiles: utilization gauges, status badges and order data from abas

The overview: every machine with utilization, daily runtime, piece count and the running abas order including open quantity and due date. Grouped into milling, turning and toolmaking — plus the PV system and the compressor as equipment tiles.

Machine detail page with the current order, scheduled operations and the runtime history as a bar chart

The detail page of a lathe: the current order with its progress, the next operations from abas and the runtime history — from the weekly overview down to the machine counter with more than 14,000 operating hours.

Machine detail page in the smartphone view

The same page on a smartphone: the foreman sees machine status and work queue on his phone out in the shop — no app, straight in the browser.

Six data sources, one screen

Every machine speaks its own language. The connectors gather everything, normalize it and write it to a shared time-series database (InfluxDB) — the dashboard only ever reads from a single source.

MTConnect — the Okuma fleet

The turning and milling centers deliver status, program, spindle data and runtimes via the open MTConnect protocol. The connector finds new machines on the network by itself via auto-discovery — including parsing of the NC program header with drawing number and target times.

Okuma CNC Auto-discovery

Brother — when there is no protocol

The Brother machining centers have no machine-data interface — but they do have a web interface. The connector reads it directly and delivers the same normalized values as MTConnect. No machine is left out just because it lacks a standard.

HTML parsing No retrofit needed

abas ERP — the work queue

The order data comes via REST straight from an abas infosystem — the very same work queue list the shop-floor data terminals show. No middleware, no duplicate maintenance: whatever production control plans is what appears on the tile.

abas REST / infosystem Read-only

Energy & compressed air

The PV inverters report via Modbus TCP, the smart meter via SMA Speedwire, the Atlas Copco compressor via its manufacturer protocol. The result: equipment tiles with energy flow, self-sufficiency rate, electricity costs and system pressure — production and infrastructure in one picture.

Modbus TCP SMA Speedwire

How we built it

Keep what exists, add what's missing, verify everything.

Illustration: documentation is checked against real measurements with a magnifying glass

Verified, not assumed.

Every interface was checked against the real system — from the abas infosystem to the field variants of the NC program headers. Along the way we found and fixed a data loss that swallowed a drawing number depending on how it was written.

Measured on the live system Hidden bugs found
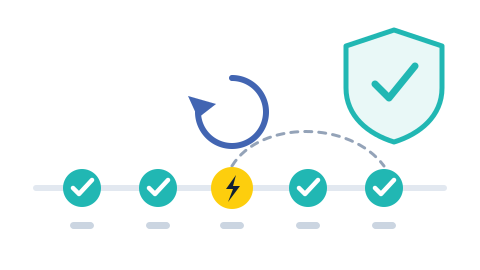
Illustration: postings on a timeline, a failure is retried automatically

Honest when something is missing.

If a connector delivers no data, the tile shows "Offline" instead of a false "stopped". Failures of one data source are isolated — a faulted machine or a hanging query never takes down the whole dashboard.

Offline detection Failures isolated
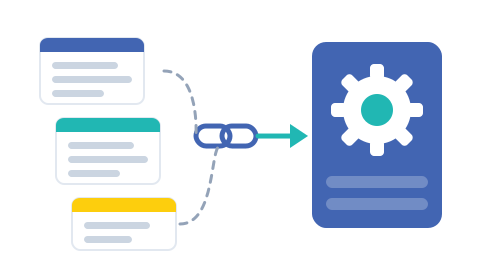
Illustration: documents flow through the REST interface into the ERP

Configuration instead of code.

New machines are created with a click: take them over from the database or import them from the abas workstations, choose group and assignment — done. Every change is logged, and the interface is protected by a login.

Machines at a click Change log
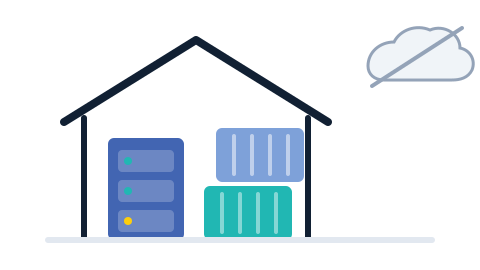
Illustration: servers and containers run inside your own house

On existing infrastructure.

The dashboard runs as a Docker container on the customer's existing Linux server and keeps using the time-series database that was already in place — the entire history since data collection began was preserved. No cloud, no per-machine license.

On-premise Docker

What does this mean for you?

The machine park at R&W is just one example. The same craftsmanship brings whatever knows status and orders in your company onto one screen — vendor-independent, even without a modern interface.

CNC machines of any make Machine & production data capture ERP work queue Energy & photovoltaics Compressed air & building services Test rigs & measuring machines Legacy machines via retrofit

Do you know what your machines are doing right now?

If getting a picture of your production still takes Grafana, ERP screens and a walk through the shop: tell us about it. There is usually more in your machines than you can see.

Get in touch